In my current job, we mainly use Datadog to get a good look at our entire infrastructure. I've had experience with other monitoring tools like Grafana and Prometheus before, but diving into Datadog is a new experience for me. This article breaks down what Datadog is and highlights its key features based on my observations.
What is Datadog?
Datadog is a powerful observability platform delivered as a Software-as-a-Service (SaaS). It excels at collecting and consolidating diverse monitoring data—metrics, traces, and logs—from your systems. The platform's strength lies in unifying this data into a central hub, making it easily accessible and organized. With an intuitive interface, Datadog enables effective issue detection, diagnosis, and resolution. In essence, it's a comprehensive tool that simplifies the complexities of monitoring and enhances operational visibility.
Universal Service Monitoring
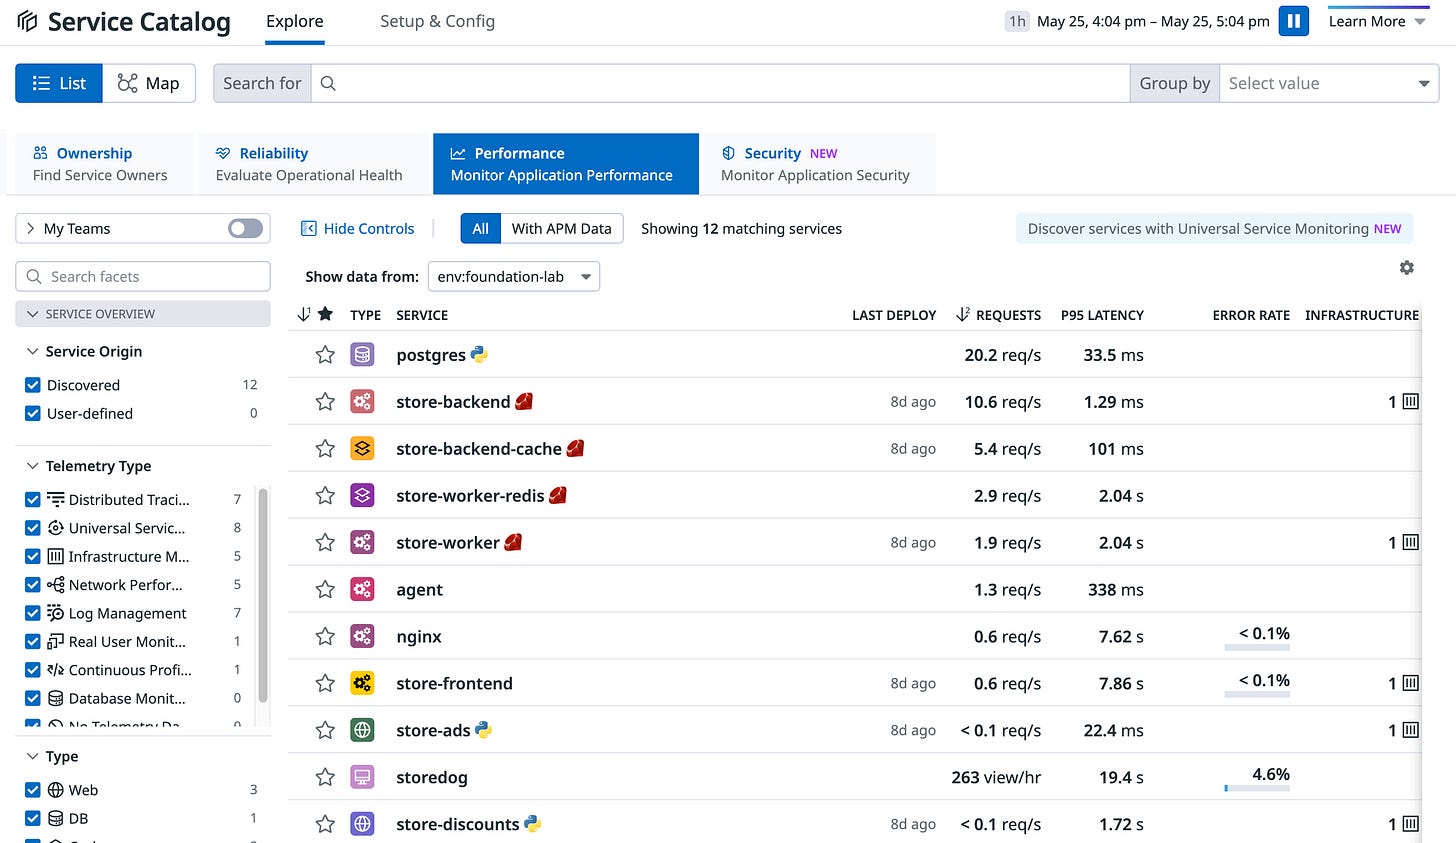
USM provides an overview of service health metrics across your entire tech stack, without requiring changes to your code. Instead, it depends on a configured Datadog Agent and Unified Service Tagging to collect data about your existing services, accessible through the Service Catalog.
Unlike demanding alterations to your application code and redeployment, USM only needs a bit of configuration for your Agent.
Enabling USM involves the following steps:
For Linux, your service must run in a container.
The Datadog Agent needs installation alongside your service.
The Unified Service Tagging's env tag must be applied to your deployment.
Once done, you can enable USM in your Agent based on your service deployment. For instance, you can configure your docker-compose.yml file for Docker Compose.
Unified Service Tagging
USM can identify services through common container tags (like app, short_image, and container_name) and automatically generate corresponding entries in the Service Catalog.
Once discovered, Datadog lets you access request, error, and duration metrics for both inbound and outbound traffic. These metrics aid in setting up alerts, tracking deployments, and establishing service level objectives (SLOs), offering a comprehensive view of all services across your infrastructure.
Service Catalog
The Service Catalog serves as a central hub to view all services in your application, including those detected by USM. Developers and site reliability engineers benefit from a detailed view of all services, their structures, and links to additional information. It enhances the on-call experience by providing correct ownership information, communication channels, and easy access to monitoring and troubleshooting details. In case of incidents, it accelerates recovery by instilling confidence and simplifying the location of owners for upstream and downstream services and dependencies.
Logs
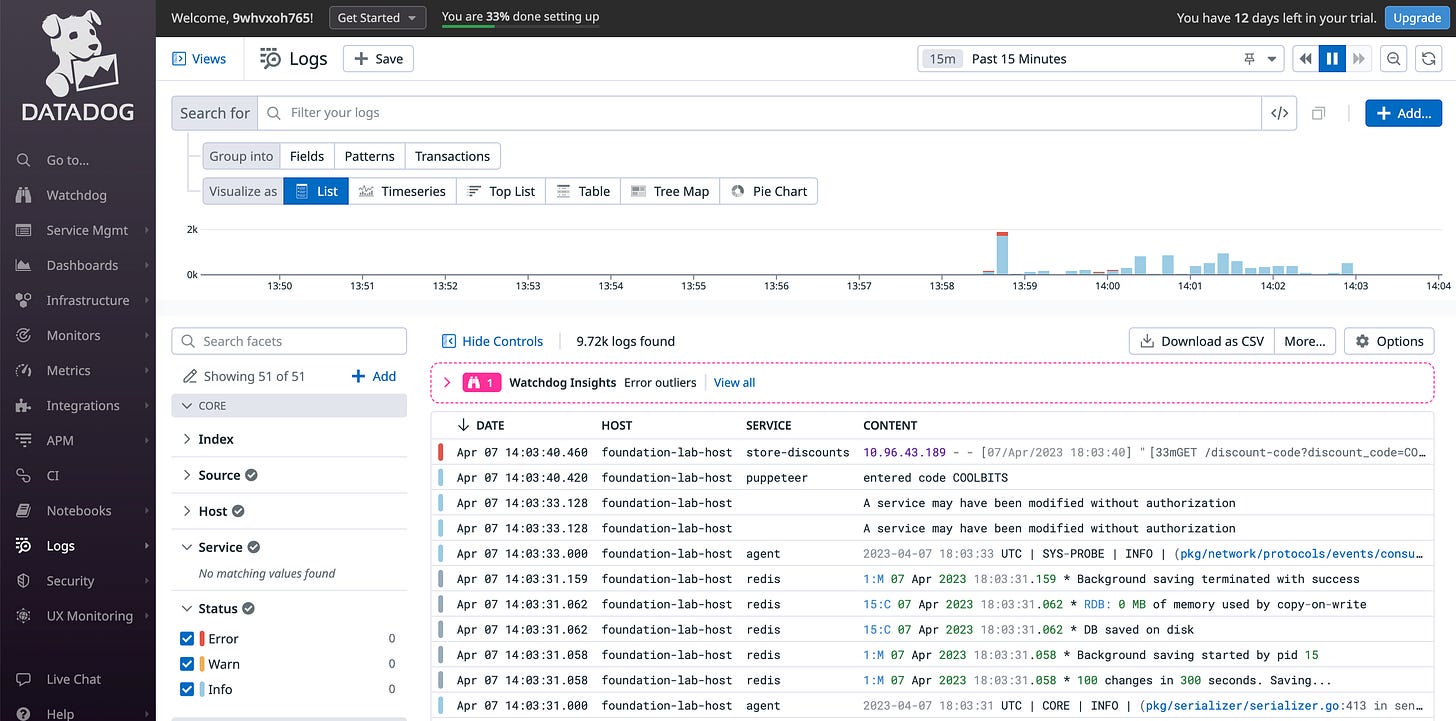
Datadog Log Management efficiently handles your log collection, processing, archival, exploration, and monitoring needs without constraints.
When utilizing Datadog Log Management:
Collect logs seamlessly from various sources like hosts, containers, and cloud providers.
Enhance logs with pipelines and processors, create metrics, and manage storage-optimized archives through Log Configuration.
Connect logs to metrics and traces for comprehensive insights.
Explore and analyze logs in the Log Explorer, which serves as a central hub for investigation.
Log Explorer Features:
Browse, search, and filter logs for specific content.
Group content, visualize patterns, and export logs.
Apply search queries with terms and Boolean operators.
Utilize log facets for filtering based on tags and attributes.
Group logs into fields, patterns, and transactions for focused insights.
Choose visualizations like lists, timeseries, top lists, and charts.
Export log exploration as saved views, Dashboard widgets, monitors, and more.
Metrics
Metrics serve as the smallest unit in Datadog, providing profound insights when visualized, measured, and monitored.
Numerical measurements (e.g., latency, error rates) over time, collected and retained as data points with values and timestamps.
Metrics Explorer
Customizable hub to examine and visualize metrics.
Utilize the query editor for customization.
Search for tag values, define filtering scope, and select aggregation methods.
Add functions to queries for deeper insights.
Monitors
Continuously checks metrics, integration availability, and more for defined conditions.
Notifications via Datadog app, email, or chat platform when thresholds are exceeded.
Various monitor types include metric monitors, service checks, APM monitors, synthetics monitors, and log monitors.
Customizable and can be used to create Service Level Objectives (SLOs).
Service Level Objectives (SLOs):
Metrics used as Service Level Indicators (SLIs) for measuring service quality.
SLIs monitored over time to establish clear targets (SLOs) for service quality.
Ensures a consistent customer experience, balancing feature development with stability.
Provides a roadmap for defining, measuring, and improving service quality.
Integrations
Integrations enable Datadog to get the data it needs from your services. Datadog Agent — which is a software running on your host is one example. Datadog Agent’s default core integrations cover the most common use-cases.
Datadog Agent is a software running on hosts, collecting process-level events and metrics.
Sends data to Datadog for analysis of monitoring and performance.
Covers common infrastructure attributes: disk, CPU, memory, network throughput.
Customizable with community integrations or self-made solutions.
Integration Types:
Agent-based:
Installed with Datadog Agent, uses Python class method "check" for metric definition.
Authentication-based:
Set up in Datadog, requiring credentials for API data (e.g., Slack, AWS, Azure).
Library:
Uses Datadog API for monitoring applications based on language (e.g., Node.js, Python).
Dashboards
Display charts, tables, and notes about sent data.
Track and monitor critical metrics for system health.
Central location for monitoring, identifying issues, and detecting trends.
Provides clear and concise overview of infrastructure.
Dashboards can be shared through URL or email link.
Viewable in real-time with no data modification ability.
Dashboards can be cloned, customized, or created from scratch.
Out-of-the-Box Dashboards:
Datadog offers pre-built dashboards for quick start.
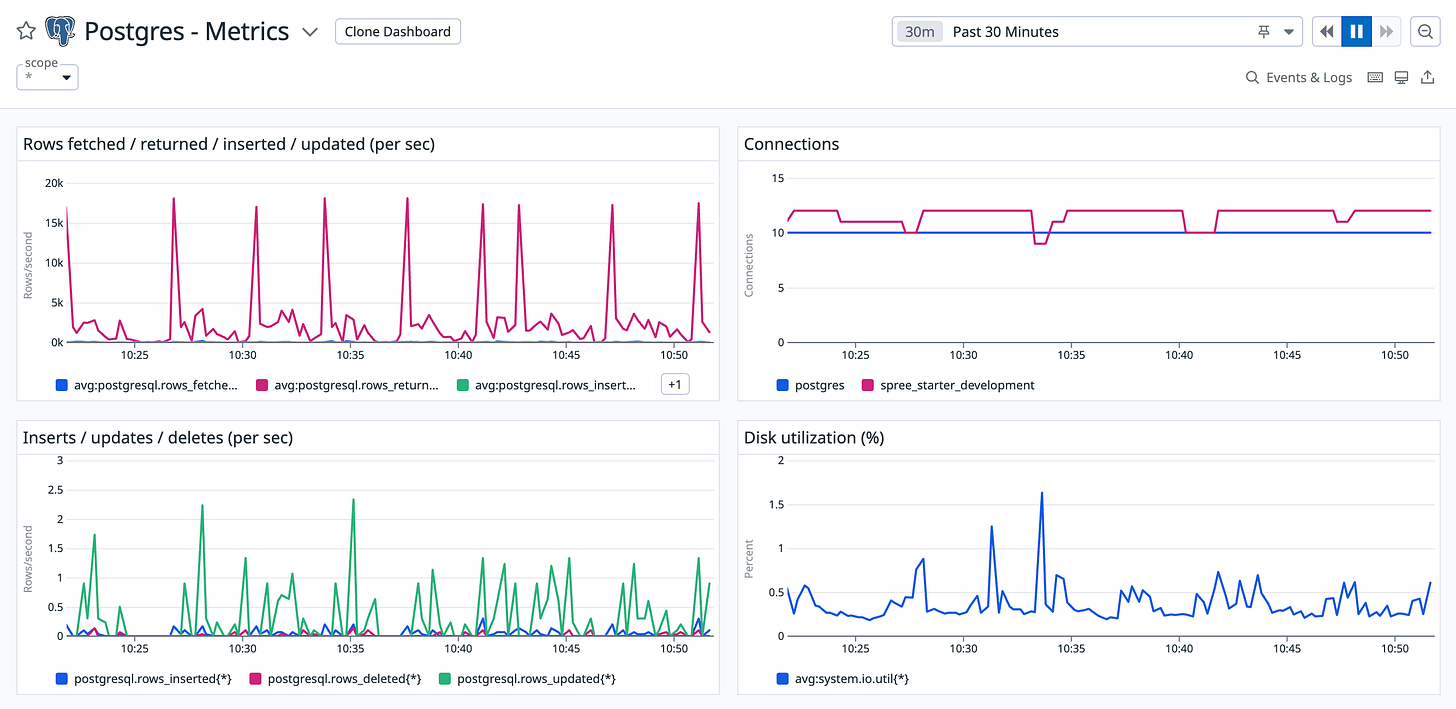
Based on integrations (e.g., Postgres, Docker) or application features (e.g., Real User Monitoring).
Layout Types:
Grid-based Dashboards:
Commonly used for status boards or storytelling views.
Real-time updates, representing fixed points in the past.
Screenboards:
Free-form layout similar to grid layout.
Timeboards:
Automatic layout representing a single moment in time.
Used for troubleshooting, correlation analysis, and data exploration.
Widgets:
Timeseries: Visualizes metric data over time.
Heat maps: Color-coded view of aggregated metrics across tags.
Top lists: Displays top values for a metric.
Event timelines: Shows a timeline of events.
Right combination creates powerful, informative dashboards for critical insights into system, service, and business performance.
References
https://learn.datadoghq.com/
https://docs.datadoghq.com/
Thanks for reading my post! Let’s stay in touch 👋🏼
🐦 Follow me on Twitter for real-time updates, tech discussions, and more.
🗞️ Subscribe to this newsletter for weekly posts.


